Samit Uttarkar

Samit Uttarkar

I'm a Data Scientist

About Me

Hello, I'm Samit Uttarkar, a fervent Data Scientist with an insatiable curiosity for uncovering hidden patterns within complex data sets. My journey in data science began with a Bachelor's degree in Physics, where I first discovered the power of data analysis. Now, as a Master's student in Data Science (Business and Management) at the University of Manchester, I'm honing my skills to transform raw data into actionable insights that drive business success.

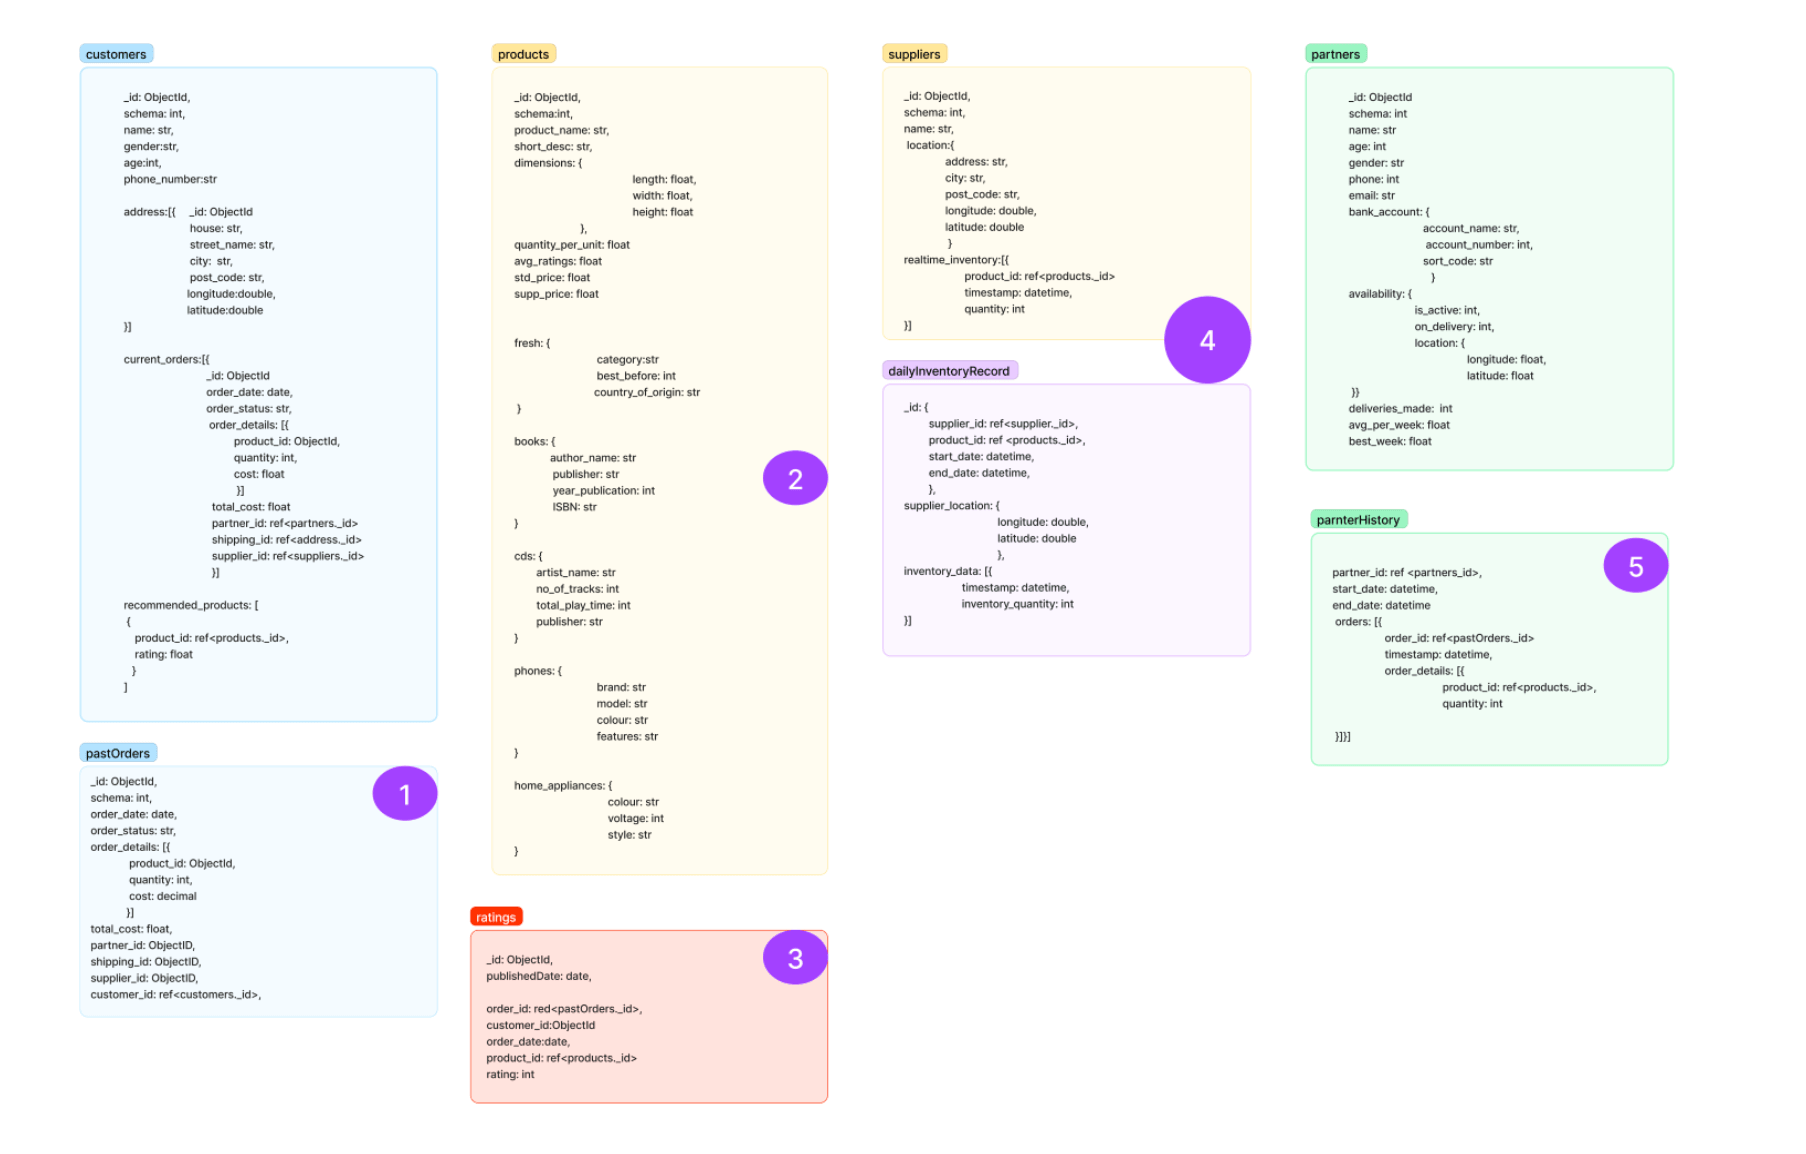
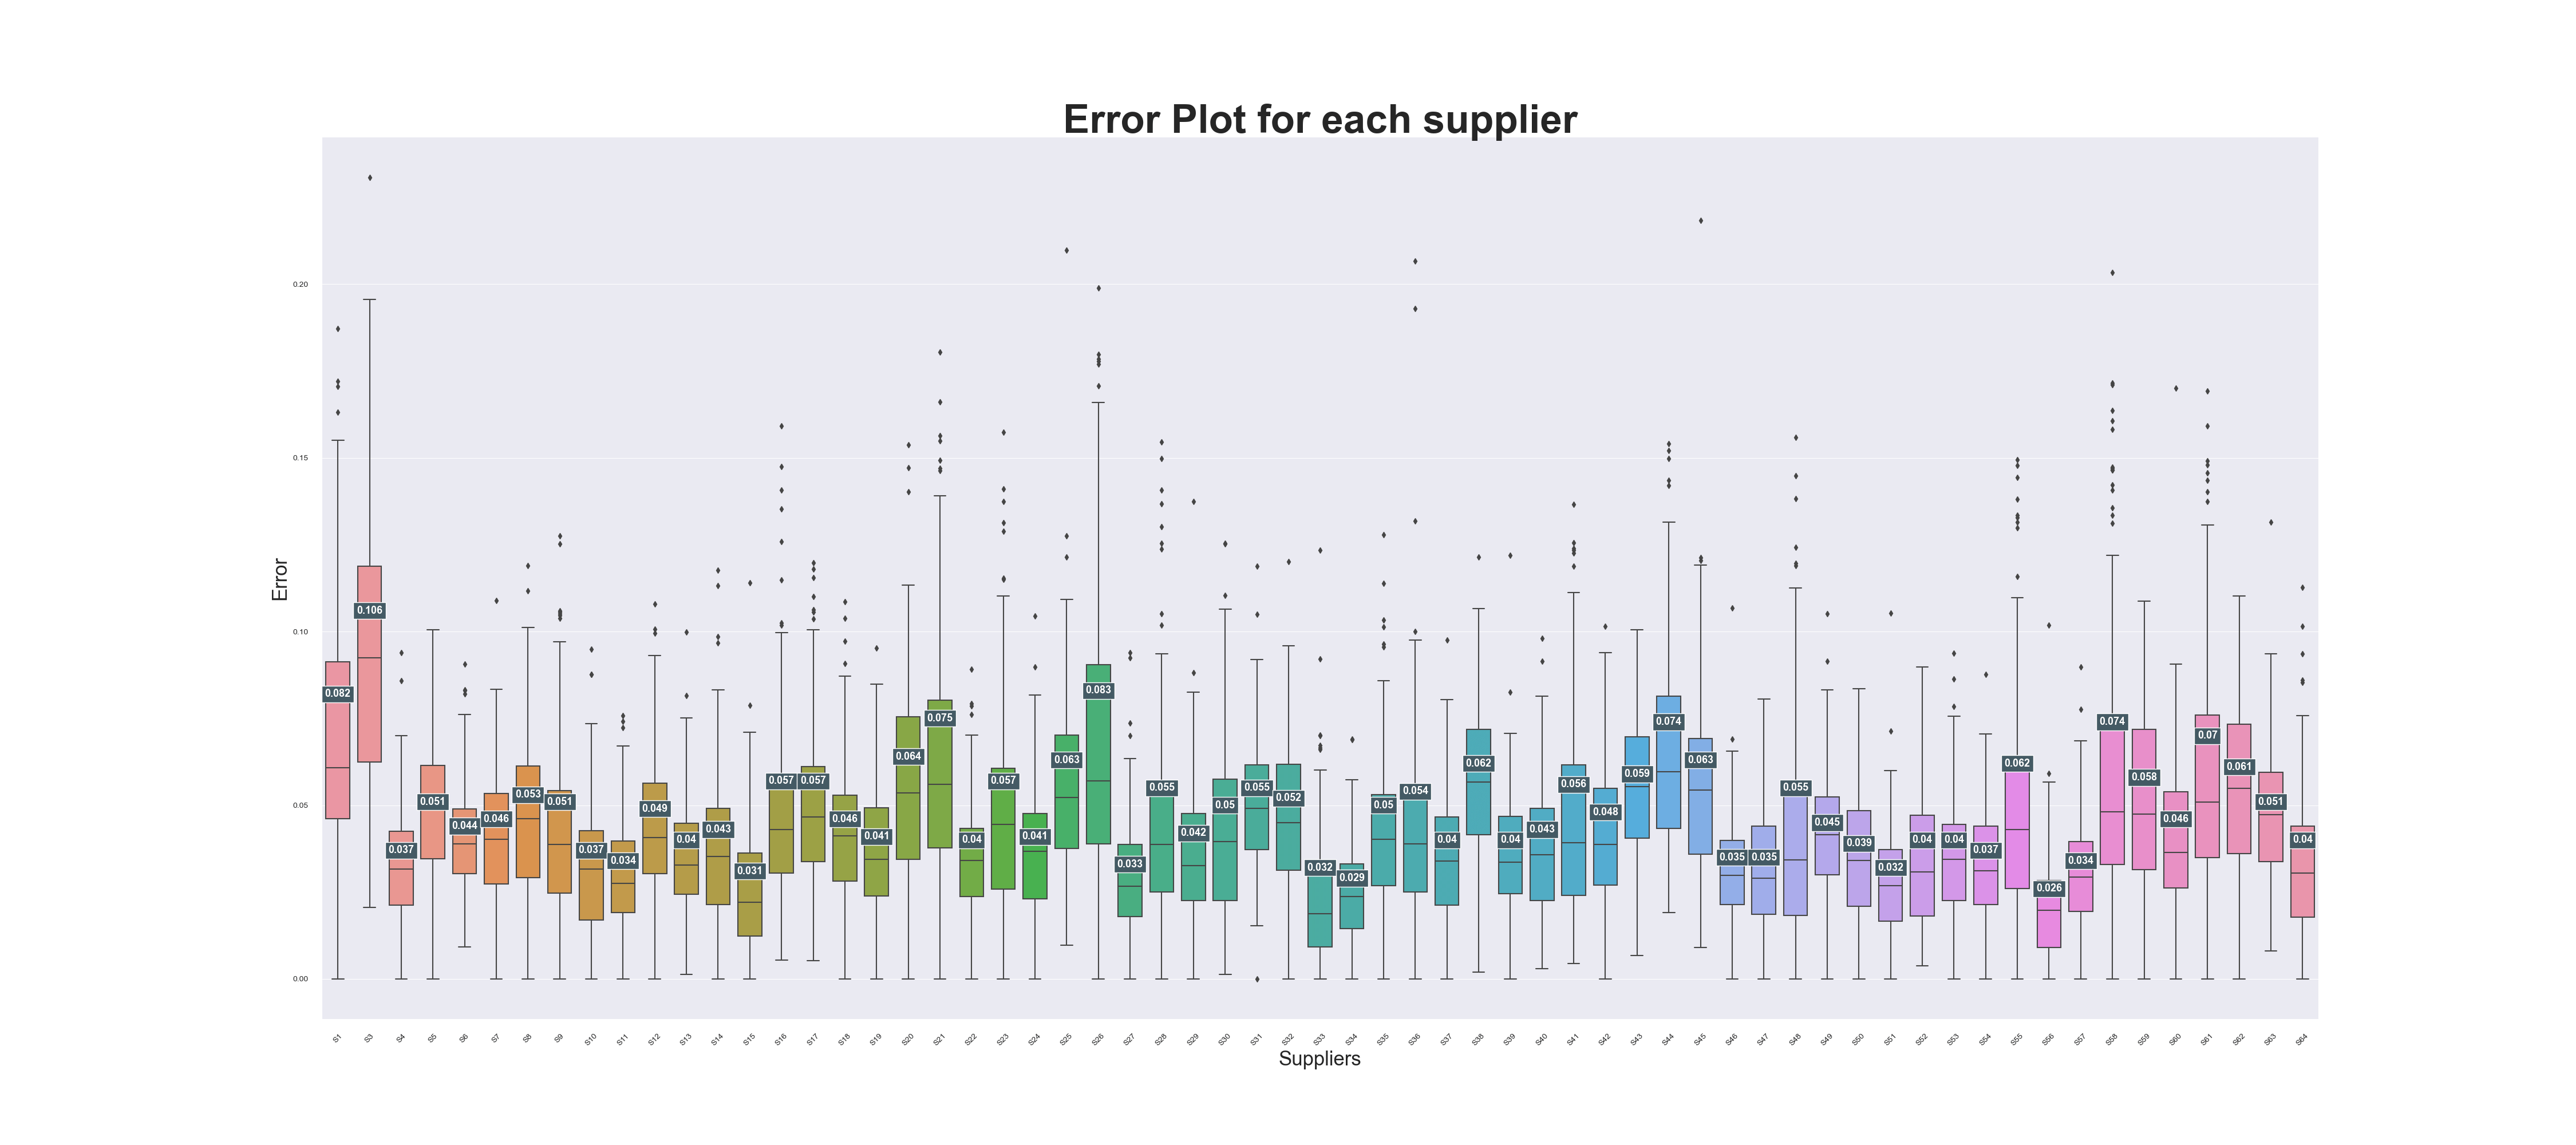
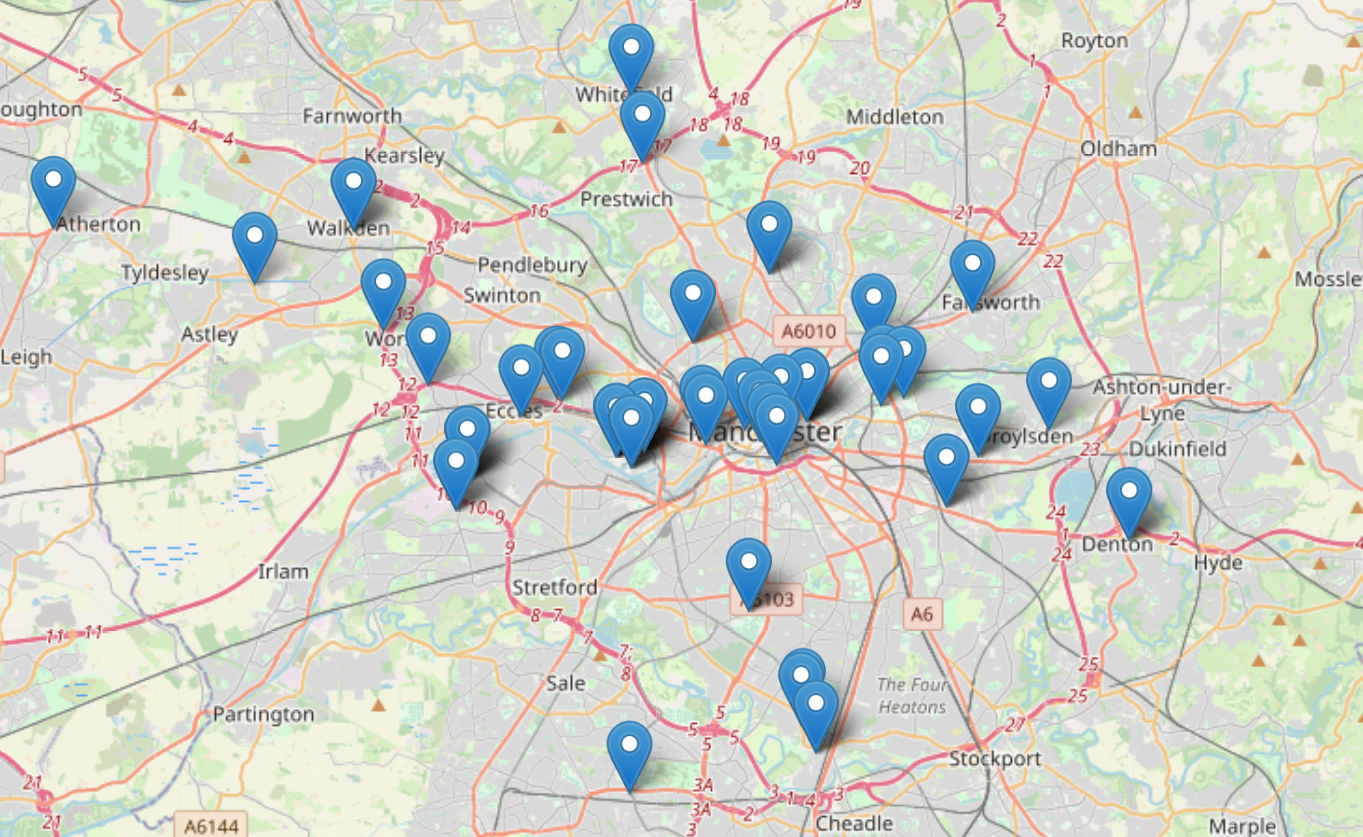
My passion for data science is not just academic; it's a driving force that has led me to work on a variety of real-world projects. From developing a geojson data file for electric bus charging sites to designing a NoSQL schema for an online shopping website, my work has always been about making a difference. I've used machine learning models to predict the best suppliers, and I've leveraged Python, R, and JavaScript to create innovative solutions.

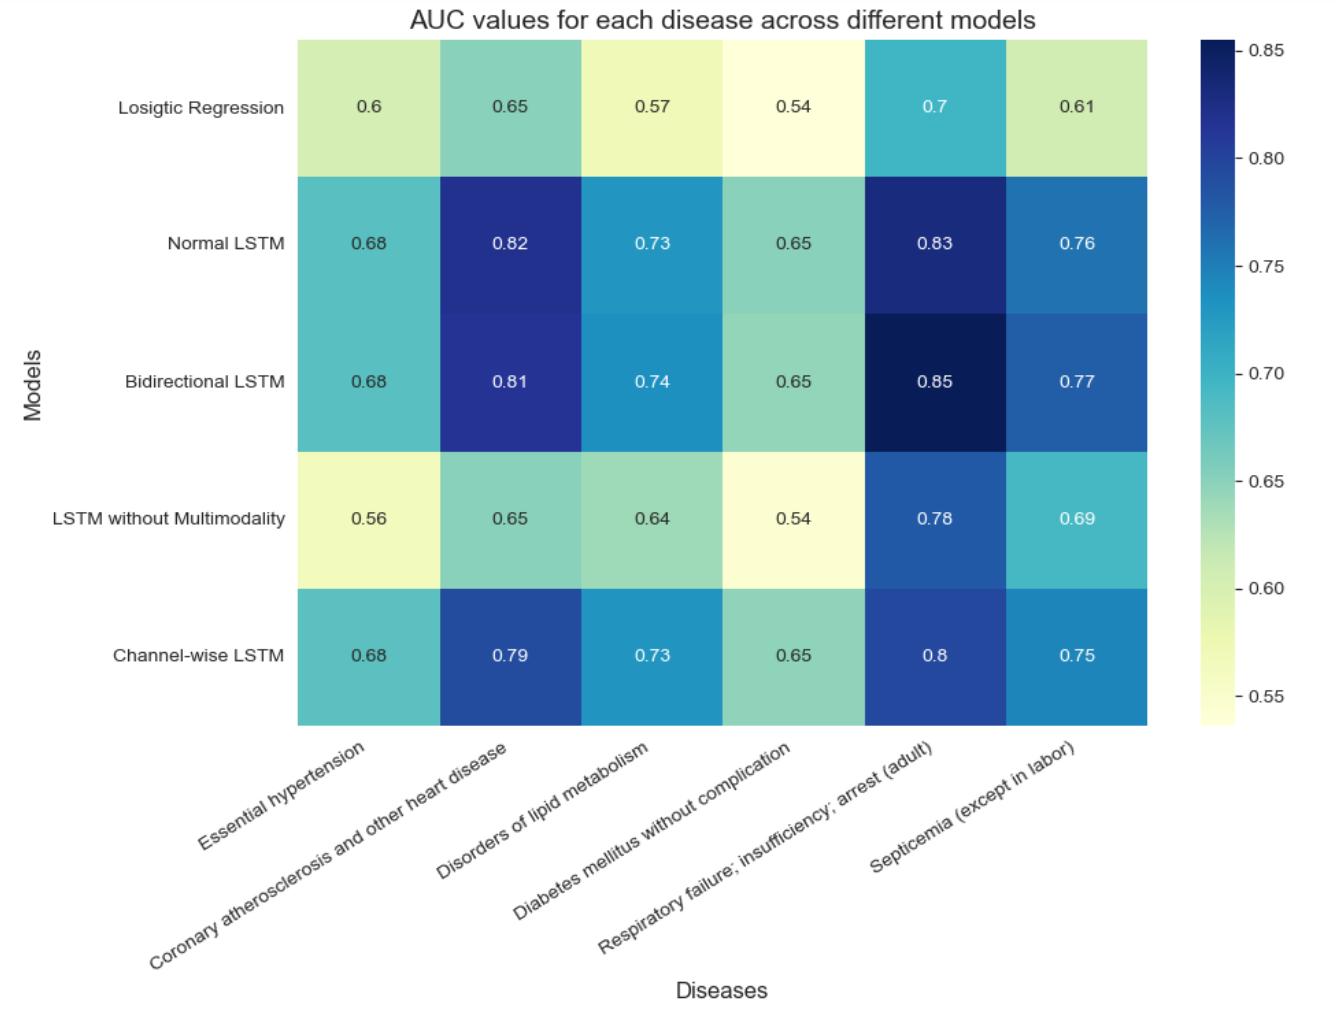
As a co-founder of a start-up, I've experienced firsthand the power of data in shaping business strategies. I've also had the privilege of working as a Data Scientist Intern at SkillVertex, where I developed a classification model with over 88% accuracy. These experiences have taught me the importance of precision, communication, and initiative in the field of data science.

But my passion for data science extends beyond the professional sphere. As a volunteer at an NGO, I've used my skills to teach computer skills to mentally disabled individuals, demonstrating the transformative power of technology.

I'm not just a data scientist; I'm a problem solver, a team player, and a lifelong learner. I'm excited to take on new challenges, learn from them, and use my skills to make a positive impact. Whether it's through statistical analysis, machine learning, data visualization, or cloud computing, I'm always ready to dive into the data and uncover the story it has to tell.

Statistical Analysis and Computing

Machine learning (Scikit learn, Tenserflow, Pytorch)

Data Visualisation (Tableau, PowerBI)

Programming (Python, R, Javascript)

Databases (MySQL, MongoDB)

Cloud Computing (Azure, AWS)

Experience

09/2022 - 09/2023
Masters of Science in Data Science (Business and Management)

University of Manchester (Manchester, UK)

  • Concentrations: Data Analytics and Machine Learning to solve Business related problems
  • Relevant Coursework: Statistics and Machine learning, Business Analytics, Understanding Databases and Environment, Data Analytics and Artificial Intelligence in Finance, Simulation and Risk analysis
  • Societies: Manchester University Data Science Society
06/2019 – 06/2022
Bachelors of Science in Physics

St. Xavier’s College (Mumbai, India)

  • Relevant Coursework: Mathematical Physics, Computer Programming, Discrete Mathematics, Economics
  • Societies: The Society of Physics (Sigma Phi)
  • Thesis : Finding Velocity dispersion of the stars in Andromeda Galaxy by applying data analysis techniques using Python and MATLAB
02/2023 – 05/2023

Optibus (Manchester, UK)

Data Science Consultant (Academic Project)

  • Led weekly meetings and a team of 6 to create a geojson file, pinpointing 67 potential electric bus charging spots in Greater Manchester.
  • Managed data preprocessing and integration using Pandas, merging datasets like the National Charge Registry and NaPTAN for enhanced data quality.
  • Applied Python and scikit-learn to run a KNN algorithm, integrated into ArcGIS for comprehensive site analysis, aiding in the selection of 30+ optimal charging locations.
  • Earned a distinction grade and stakeholder praise for clear communication and effective problem-solving,boosting the project's success and impact.
06/2022 – 08/2022

SkillVertex (Mumbai, India)

Data Scientist Intern

  • Developed a classification problem model using logistic regression, decision trees and random forest including exploratory data analysis for the same for Employee Promotion of the company data with over 88% accuracy.
  • Improved existing machine learning models, performed extensive customer analysis and designed data modelling processed to create predictive models
  • Praised for completing all projects and improving predictive models for better efficiency

Recent works

Amazone NoSQL Databases

Portfolio-title
Title

The project involved a group of seven individuals who conducted a sales analysis for the UK-based Amazon online shopping website. Designed a NoSQL schema for Amazone using Figma and conceptualised referencing and embedding patterns on six distinct collections for optimal performance of the database. I was responsible for writing a query for the manager to check sales for the past month, finding the most recommended products, and managing the team's resources to ensure the delivery of analytical outputs and queries. In this project we Implemented a demonstration database and queries using MongoDB Compass and Python and Incorporated aggregation pipeline and pandas to perform sales analysis for Amazone

View on Project

Best Supplier Prediction

Portfolio-title
Title

This project demonstrates the use of machine learning (ML) models in recommending the best suppliers to Acme Corporation, given a set of task features. This process begins with data cleaning and preparation, exploratory data analysis (EDA), and machine learning, where results from predicted data can be obtained. Cross-validation (Leave-One-Group-Out) is used to validate the ML model score, and hyper-parameter optimization is further used to find the optimal set of hyper-parameters for improved predictions.

View on Project

Multimodal Disease Risk Prediction

Portfolio-title
Title

We embarked on a comprehensive study to harness the potential of vast datasets in enhancing patient care. Utilizing the MIMIC-III and benchmark datasets, we processed over 15GB of data, representing more than 250 million timeseries events from Electronic Health Records (EHRs). Our primary objective was to develop predictive models that could provide actionable insights into disease risks, in-hospital mortality rates, readmission frequencies, and ICU stay lengths. Leveraging TensorFlow, we designed and optimized multimodal deep learning models, with a focus on Long Short-Term Memory (LSTM) networks and their variants. Through rigorous testing and iteration, we achieved significant milestones, including a 23% increase in the Macro AUC-ROC score with our BiLSTM model. This success not only validated our approach but also showcased the effectiveness of advanced deep learning techniques in healthcare analytics.

View on Project

Electric Vehicle Charging Infrastructure for Optibus

Portfolio-title
Title

Together with a group of four other members, we embarked on a project in Greater Manchester to address the need for electric bus charging locations. By pooling data from the National Charge Registry and NaPTAN, we meticulously merged and refined the datasets to ensure accuracy. Our primary analytical tool was Python, complemented by the scikit-learn library. With the KNN algorithm, we systematically analyzed and ranked potential charging spots. To bring our findings to life and facilitate decision-making, we integrated the results into ArcGIS, providing a visual representation of the potential locations. This methodical approach led us to identify over 30 prime charging locations across the region. The project's success was evident not only in its tangible outcomes but also in the positive feedback we garnered, particularly for our adept use of tools like ArcGIS and machine learning.

View on Project

Rossmann Sales Prediction

Portfolio-title
Title

The Rossmann dataset is a historical dataset for over 1000 Rossmann stores located in different regions of Germany. The Rossmann dataset is a valuable resource for those interested in retail sales analysis. Before building forecasting models, it is necessary to understand the dataset first and pre-process it accordingly so that the predictions are accurate. This project provides data preprocessing and forecasting methods applied to the Rossmann dataset. Furthermore, in this project, We will also use the XGBoost machine learning algorithm to predict six weeks of sales data. The report outlines the forecasting method' limits and emphasise the significance of taking measures to guarantee the accuracy and dependability of the outcomes.

View on Project

Climate Analysis

Portfolio-title
Title

Visualisation of daily stream gauge measurements (which provide a sort of spatially and temporally averaged rainfall record) from the London Road gauge on Manchester's river Medlock. It's in Longsight and is station 69020 in the UK's National River Flow Archive (NRFA).

View on Project

Customer analysis

Portfolio-title
Title

The project aimed to analyze customer data of Amazon products to identify demographics and purchasing patterns of various products. The project was done using Tableau software to create beautiful visualizations that would help in understanding the data better. The project started with data collection of customer data of Amazon products, which included demographics, product category, purchase date, and purchase amount. The data was then cleaned and transformed to be ready for analysis. Using Tableau, various visualizations were created such as bar charts, heat maps, and scatter plots. These visualizations helped in identifying trends and patterns in customer behavior, such as the most popular products among different demographics, the peak buying periods for different products, and the average purchase amount for each category.

View on Project

Covid Tracker

Portfolio-title
Title

The project aimed to build a COVID-19 tracker that would track people from different countries to identify those who have taken the vaccine and those who have not. The project was done using Tableau software to create visually appealing data visualizations that would help in understanding the data better. The project began by collecting data on COVID-19 cases from different countries, which included information on the number of confirmed cases, deaths, recoveries, and vaccination status. The data was then cleaned, transformed, and prepared for analysis using Tableau. The insights generated from the analysis were valuable in helping policymakers and health organizations in making informed decisions related to vaccination drives and planning public health interventions. The visually appealing visualizations created using Tableau helped in presenting the findings in a clear and concise manner, making it easy to communicate the insights to stakeholders.

View on Project

Get In Touch

Let's talk about everything!

Don't like forms? Send me an email. 👋

Please Fill Required Fields